Public-Sector Decision Science

Rigorous statistics and applied modeling built to support high-stakes human decisions.

We partner with human services agencies, emergency communications centers, law enforcement, and critical public infrastructure to turn complex administrative and operational data into actionable tools.

Grounded in peer-reviewed research, fair machine learning, and anti-bias methodologies designed to address the structural biases present in automated decision systems.

Trusted By

Montana Department of Public Health and Human Services (DPHHS) Montana DPHHS
Predict Align Prevent Predict Align Prevent
Salem Police Employees' Union Salem Police Employees' Union
Willamette Valley Communications Center Willamette Valley Communications Center
Core Applied Areas

Three Flagship Modeling & Optimization Systems

Select any of the three practice areas below to open its detailed vignette—examining the underlying methodology, operational workflow, and peer-reviewed or software implementation.

Select an area below to inspect one vignette at a time
Active Vignette 01 / 03 — Predictive & Counterfactual Modeling
Vignette 01 · Individual & Household Decision Support

Predictive and Counterfactual Modeling

Traditional public-sector analytics stop at passive risk prediction—flagging which households or individuals might experience an adverse event without answering what to do next. Our approach goes further by combining predictive modeling with counterfactual simulation.

By leveraging existing administrative records alongside geospatial service-supply data, we build real-time decision tools and actionable strategies designed to maximize positive outcomes at the individual client or household level.

  • Household-Level "What-If" Simulation: Evaluates how a specific household's probability of success changes under different combinations of supportive services, concrete supports, or case management strategies.
  • Jurisdiction-Wide Resource Alignment: Aggregates counterfactual demand across neighborhoods to show agency leadership where service capacity is under-supplied relative to household need.
  • Audited for Algorithmic Fairness: Incorporates rigorous statistical bias-correction and fairness auditing so recommendations support equitable outcomes across demographic groups.
Peer-Reviewed Methodology · JMIR Research Protocols

Aligning a household-level service array via geospatial and counterfactual modeling

This novel framework is grounded in our team's peer-reviewed published study protocol for jurisdiction-wide prevention and service alignment.

Read the Published JRP Paper (PDF) ↗
Counterfactual Optimization Workflow Administrative Data → Actionable Strategy
1. Administrative & Spatial Data Integration Input Layer

Synthesizes longitudinal program history, household characteristics, prior service utilization, and local provider accessibility in real time.

2. Counterfactual Service Array Simulation Simulated Outcomes

Models projected positive outcome probability across candidate service pathways for an individual household profile:

Baseline (Status Quo)
48.2%
Pathway A: Standard Referral
63.5%
Pathway B: Concrete Support
74.1%
Pathway C: Matched Array ★
88.7%
3. Real-Time Actionable Recommendation Decision Support

Delivers interpretable, bias-audited guidance to caseworkers and planners—identifying both the highest-impact household strategy and regional service gaps.
Vignette 02 · Self-Sufficiency & Legislative Compliance

Case Error Risk Modeling

Public benefits and Self-Sufficiency programs process thousands of complex eligibility determinations, recertifications, and household changes every week. Even small procedural discrepancies or complex income calculations can result in payment errors.

We develop bespoke statistical and machine learning models that classify active cases by the calibrated probability that a case contains an error—using your agency's existing administrative data to focus quality assurance where it matters most.

  • Preparedness for Recent Legislation (HR1): Recent federal legislative requirements such as HR1 dramatically raise the fiscal and operational stakes of payment error rates in Self-Sufficiency programs, making proactive error detection essential to avoid federal penalties and protect program funding.
  • Bespoke Probability Classification: Rather than relying on rigid rule checklists or random QA sampling, our models estimate a continuous error risk probability for each case based on historical QC findings, case complexity, and workflow signals.
  • Actionable Pre-Review Triage: Enables supervisors and quality control teams to review high-probability cases before errors compound or enter federal audit samples.
Policy & Fiscal Urgency · HR1 Compliance

Why Case Error Risk Modeling Matters Under HR1

Under HR1's heightened accountability provisions, state human services agencies face strict payment accuracy thresholds. Identifying high-probability error cases directly from administrative data allows agencies to systematically lower error rates without overwhelming frontline staff.

Self-Sufficiency Case Risk Stratification Administrative Data → Error Probability
Tier 1 · High Error Probability Queue P(Error) ≥ 0.65

Routed for targeted pre-certification QA review and supervisory verification prior to benefit issuance or audit sampling.

Tier 2 · Moderate Complexity / Targeted Check 0.25 ≤ P(Error) < 0.65

Flagged with specific error-driver indicators (e.g., fluctuating earned income, multi-program deduction interactions, or shelter cost updates) for streamlined worker prompts.

Tier 3 · Low Error Probability (Standard Flow) P(Error) < 0.25

Proceeds through standard processing without unnecessary secondary review, preserving staff capacity for complex Self-Sufficiency cases.

Administrative Signals Modeled Bespoke Feature Engineering
Earned & Unearned Income Volatility Household Composition Shifts Recertification Timing & Churn Deduction & Shelter Verification Historical QC Audit Outcomes Caseload & Processing Bottlenecks
Vignette 03 · Emergency Services, 911, Police & Fire Dispatch

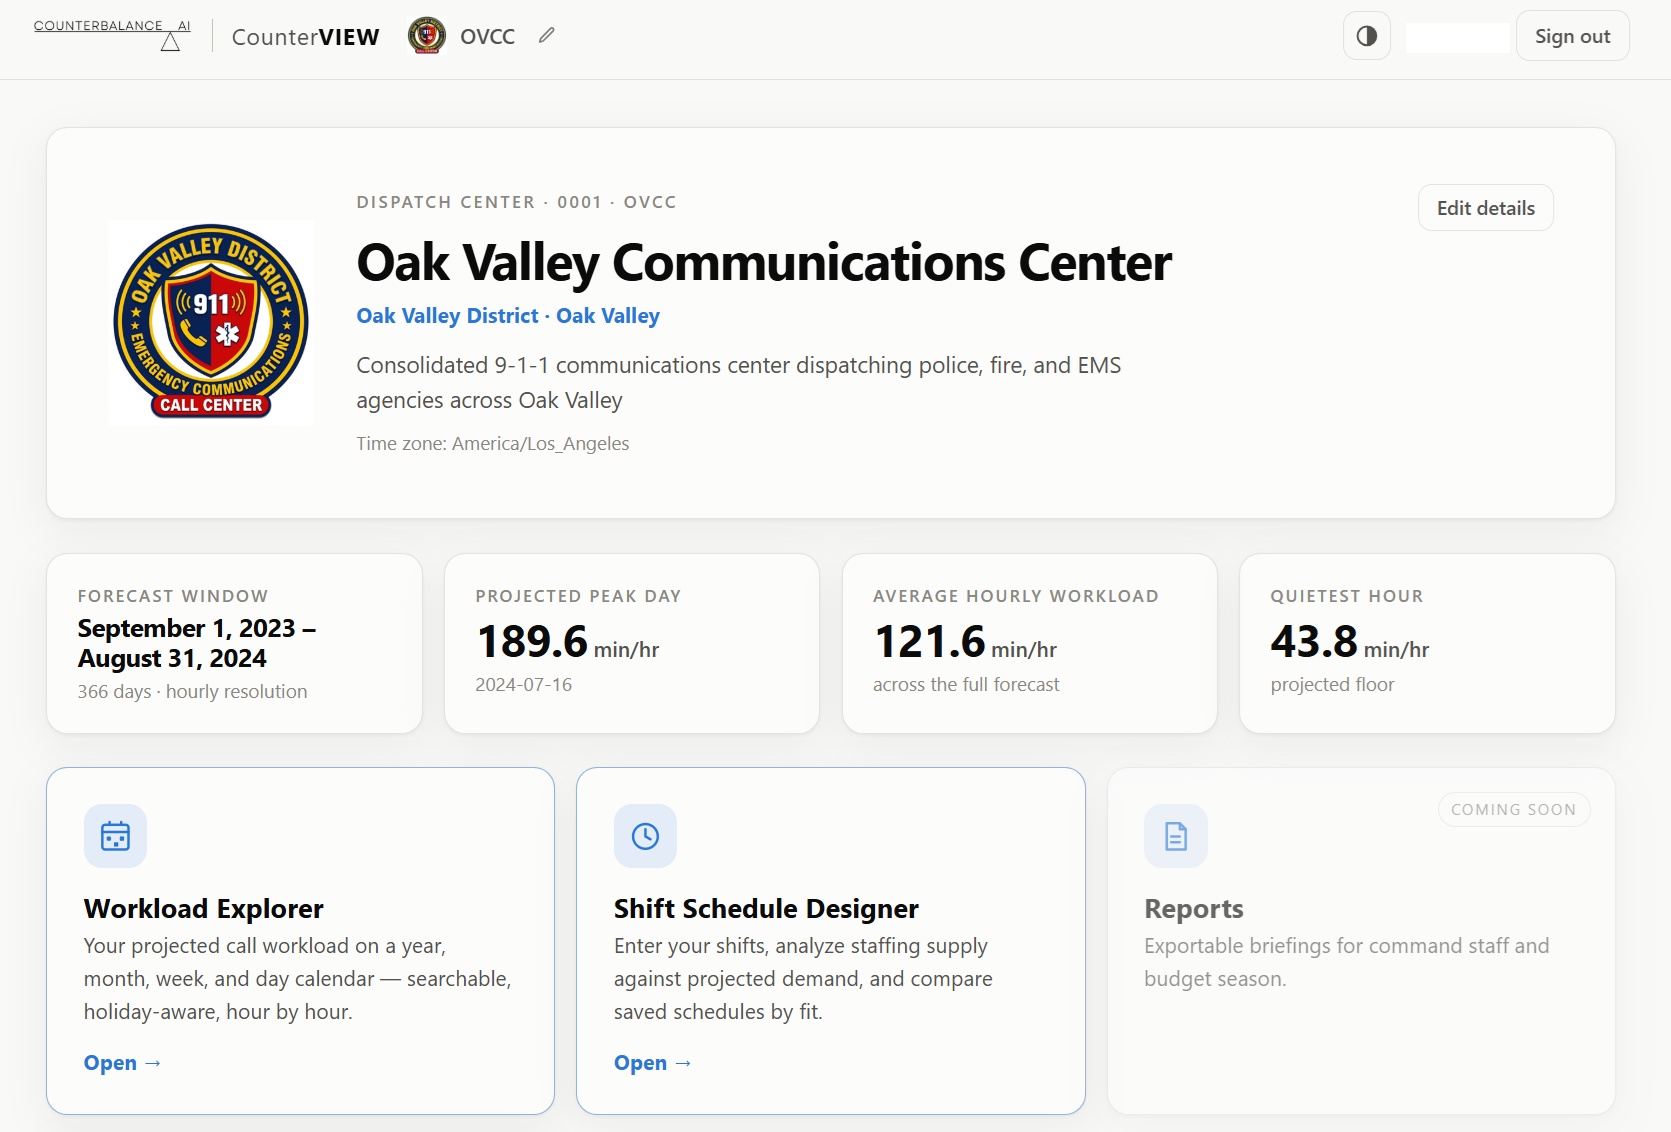
Workload and Staffing Optimization with CounterVIEW

Critical operations centers—including 911 emergency dispatch centers, police, fire, and EMS communications—face fluctuating call volumes where under-staffing risks response delays and chronic overtime leads to burnout.

Our CounterVIEW system pipes call data, CAD records, and operational workload streams directly into an interactive optimization environment—projecting demand down to the hourly level and quantifying how customized shift schedules fit real-world workload.

  • Direct Call & Workload Data Pipeline: Ingests historical and live call volume, call duration, and priority distributions to forecast workload hour-by-hour and day-by-day across the entire year.
  • Custom Shift Schedule Exploration: Leadership and employee unions can test candidate shift configurations (such as 5x8s, 4x10s, 3x12s + 4s, and staggered start times) side by side.
  • Quantified Hourly Fit Score: Measures the exact percentage alignment between scheduled headcount and projected hourly workload—exposing net staffing deficits and surpluses before a schedule is deployed.
Interactive Visual Demonstration

Explore the CounterVIEW Interface Graphics

Use the three view tabs to inspect how CounterVIEW compares hourly staffing vs. workload, evaluates custom shift schedules (improving fit from 88% to 94% with the same FTEs), and tracks daily net staffing across 365 days.

CounterVIEW Workload and Staffing Optimization Interface
CounterVIEW View 1: Hourly Net Staffing Needs (Under/Over) & Hourly Staffing vs. Workload curves (88% Fit vs. 94% Fit at 65 FTE).
Full Analytical Spectrum

Broader Capabilities & Specialties

Beyond our three flagship modeling platforms, our team provides end-to-end statistical consulting, algorithmic auditing, spatial analysis, and natural language processing tailored to public-sector missions.

01 / CAPABILITY

Predictive Analytics

Leveraging historical administrative and operational data to forecast future trends, demand, and outcomes for informed decision-making.

02 / CAPABILITY

Algorithmic Fairness

Developing, auditing, and correcting algorithms to ensure equitable and unbiased results aligned with your agency's mission and values.

03 / CAPABILITY

Geospatial Analysis

Uncovering location-based insights, service deserts, and spatial patterns to optimize regional resource allocation and planning.

04 / CAPABILITY

Counterfactual Modeling

Simulating alternative decision pathways to optimize future outcomes for individuals, households, and public agencies.

05 / CAPABILITY

Text Analytics & NLP

Applying natural language processing to unstructured case notes and narratives to surface critical context not captured in structured fields.

06 / CAPABILITY

Program Evaluation

Applying rigorous causal and statistical methods to measure the real-world effectiveness and impact of public services and policies.

07 / CAPABILITY

Strategic Planning

Evaluating system-wide decision making to anticipate the downstream impact of legislative mandates, policy shifts, or practice changes.

08 / CAPABILITY

Schedule Optimization

Human-centered machine learning and operations research solutions that align shift schedules with hourly and seasonal workload.

Peer-Reviewed Foundation

Published Research by Our Team

Our methods are not black-box vendor claims—they are peer-reviewed, published in leading scientific journals, and built by Ph.D. researchers in statistics, machine learning, and spatial planning.

JMIR Research Protocols Peer-Reviewed Paper (PDF)

Aligning a household-level service array via geospatial and counterfactual modeling: study protocol for a jurisdiction-wide child maltreatment prevention effort

Jamaal Green, Brian Glass, Jordan Purdy, & Daley

Introduces our framework for combining administrative data, geospatial accessibility analysis, and counterfactual modeling to identify household-specific interventions that maximize positive outcomes and align regional service supply.

Children and Youth Services Review Peer-Reviewed Paper (PDF)

The pursuit of algorithmic fairness: On “Correcting” algorithmic unfairness in a child welfare reunification success classifier

Jordan Purdy & Brian Glass

Examines mathematical definitions of algorithmic fairness in high-stakes human services classifiers and demonstrates rigorous anti-bias processes to evaluate and mitigate disparities in automated decision-support tools.

Complete Academic Publication Histories Explore additional peer-reviewed articles, conference proceedings, and citations on Google Scholar.
Leadership & Principal Scientists

Meet the Team

Every engagement is led directly by our founding Ph.D. scientists—combining expertise in mathematical statistics, machine learning, cognitive science, and spatial analytics.